
Piktochart is a browser-based visual content platform founded in 2012 and used by over 14 million users worldwide, as confirmed by AIChief’s May 2026 review. Its founding premise has not changed: make it easy for non-designers to turn data, information and complex ideas into professional-looking infographics, presentations and reports. without needing design experience or Photoshop.
In 2026, Piktochart has expanded significantly from its infographic-only origins. The platform now covers visual infographics, presentations, reports, social media graphics, video editing and a suite of AI tools. including an AI text-to-infographic generator that creates a complete infographic from a typed topic in seconds.
Infographics, presentations, reports, flyers, posters, social media graphics and print materials. 5,000+ templates. Drag-and-drop editor. Google Sheets live data integration. Charts, maps and timelines.
Edit videos and add automatic subtitles in multiple languages. AI video generation powered by Sora 2 and Veo 3.1. Create video content alongside visual infographics in one platform.
AI text-to-infographic, text-to-presentation and text-to-report generators. Plus: Image Generator, Image Modifier, Upscaler, Background Remover, Image Restorer and Icon Generator. Free 60 credits/mo, Pro 500, Business 1,000.
Best for: marketers, educators, HR professionals, consultants and non-profits who regularly need to turn data and complex information into professional infographics, data-driven presentations and visual reports without design skills.
Pricing: Free (7-day limited access, only 2 lifetime downloads. read the warning below). Pro $14/mo annual ($168/yr) or $29/mo monthly. Business $24/mo annual ($288/yr) or $49/mo monthly. Education $39.99/year. Enterprise custom.
Biggest strength: AI text-to-visual generators. Type a topic and Piktochart’s AI creates a complete infographic, presentation or report in seconds. Combined with Google Sheets live data sync, 5,000+ templates and 6+ AI image tools, it is the most comprehensive AI-powered infographic platform available at this price point.
Main weakness: the free plan is not a working free tier. 2 total lifetime downloads makes it a demo only. PPT export is locked to the Business plan ($24/mo annual). No mobile app. Narrower template library than Canva (5,000 vs 3.6M+).
Bottom line: if infographics, data-driven reports and presentations are your regular output, Piktochart at $14/mo annual is strong value with AI generators that no general design tool matches. For general graphic design, Canva is broader and cheaper.
This is a significant difference from competitors: Canva’s free plan is permanent with thousands of downloads. BeFunky’s free plan has no download watermark on basic exports. Visme’s free plan is permanent with unlimited projects.
For Piktochart, the minimum practical paid plan is Pro at $14/mo annual. The Education plan at $39.99/year ($3.33/mo) is an exceptional deal if you qualify. Verify your plan access at piktochart.com/pricing before assuming the free tier covers your needs.
Key Features
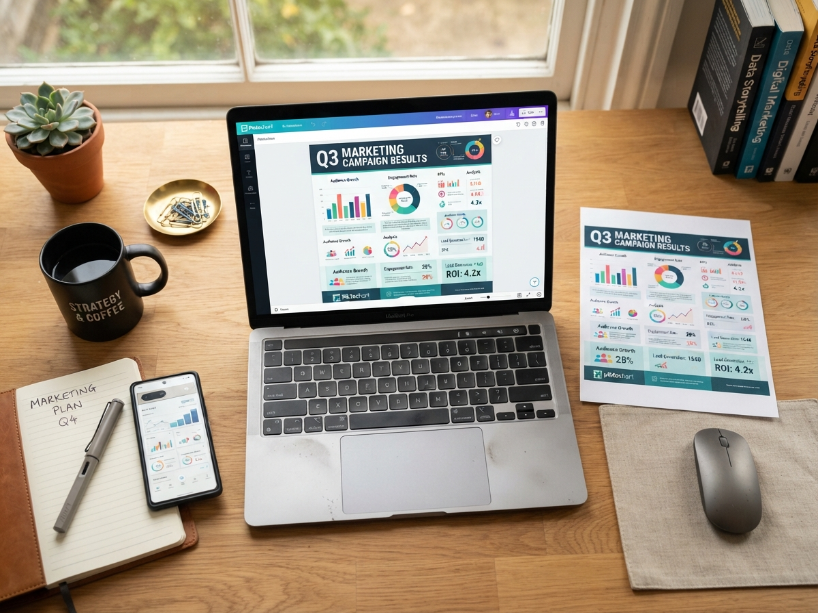
AI Text-to-Infographic: type a topic or paste text content, and Piktochart generates a complete, ready-to-edit infographic with layout, icons, charts and text organized by the AI. For marketers, educators and HR teams who regularly create infographics from data, this eliminates the blank-canvas problem. As confirmed by CreatorStackClub’s March 2026 review, manual editing is still needed for brand alignment and final polish, but the AI-generated starting point saves significant time versus starting from scratch.
AI Text-to-Presentation: generate a full multi-slide presentation from a text prompt or uploaded document. Piktochart organizes the content into slides with appropriate layouts, charts and visual hierarchy.
AI Text-to-Report: generate structured visual reports from documents or data. Particularly useful for marketing analytics, HR metrics reports and educational summaries where recurring report formats need to be produced quickly.
Pikto AI Studio: Image Tools
As confirmed by aiproductivity.ai’s review (pricing re-verified June 2026), the Pikto AI Studio includes six separate AI image tools beyond the text-to-visual generators:
AI Image Generator: create custom images from text prompts for use within infographics and designs. Free plan: 60 credits/mo. Pro: 500 credits/mo. Business: 1,000 credits/mo.
AI Image Modifier: modify existing images using AI prompts. change style, background, or elements of an uploaded image.
AI Image Upscaler: upscale low-resolution images for use in print or large-format output.
AI Background Remover: one-click background removal for photos used in infographic designs.
AI Image Restorer: restore and enhance old or damaged photos.
AI Icon Generator: generate custom icons from text prompts, released as an updated feature in 2026. Useful for creating unique icons that match a specific infographic topic.
Credits reset monthly and do not roll over. Heavy AI users should treat Pro’s 500 credits as a budget. approximately 50 to 100 AI image generations per month depending on the feature used.
Data Visualization and Google Sheets Integration
As confirmed by CreatorStackClub’s March 2026 review, Piktochart’s data visualization is its strongest differentiation from general design tools. The platform covers:
Charts and graphs: bar, line, pie, donut, area, scatter and more. Customize colors, fonts and sizes with a click. Chart type can be changed after data entry.
Google Sheets live data integration: connect a chart to a Google Sheets spreadsheet and the chart automatically updates whenever the spreadsheet data changes. As confirmed by aiproductivity.ai’s review, this is unmatched in browser-based infographic tools. Canva does not offer live Google Sheets sync, and Visme offers it only on Pro plans.
Maps: editable interactive maps for geographic data visualization. Useful for demographic data, regional analysis and location-based infographics.
Timelines: pre-built timeline layouts for project plans, historical context and process flows.
Excel import: import data directly from Excel files into Piktochart charts without manual re-entry.
The Template Library
As confirmed by the official Piktochart Pro page and multiple 2026 reviews, Piktochart offers 5,000+ templates across infographics, presentations, reports, social media posts, flyers, posters, business cards, wallpapers, resumes, newsletters, proposals and more.
As confirmed by CreatorStackClub’s March 2026 review, 5,000 is significantly smaller than Canva’s 3.6M+ template library. For general social media content and marketing assets, Canva’s template depth is considerably stronger. For infographic-specific and data-driven visual report templates, Piktochart’s focused library is well-executed and well-organized for its target use cases.
Video Editing and AI Video
As confirmed by aiproductivity.ai’s review and topsocialtools.com’s 2026 profile, Piktochart includes a video editing module with automatic subtitle generation in multiple languages. An AI video generation capability powered by Sora 2 and Veo 3.1 has been added to the platform in 2025-2026, enabling video content creation alongside infographic and presentation work.
Brand Assets and Collaboration
Brand Assets: upload brand colors, fonts and logos to a central hub. Apply brand colors consistently across all designs. As confirmed by the official Piktochart pricing page, one color palette per workspace is available on the free plan. Pro unlocks full brand asset management.
Team workspace: as confirmed by the official Piktochart pricing page, the free team workspace supports up to 4 members (1 owner plus 3) at no cost. Beyond 4 members, a Pro plan per member is required.
Collaboration: commenting and revision features for team review. As confirmed by topsocialtools.com’s 2026 review, real-time collaborative editing is available for teams on Pro and Business plans.
Pricing
| Plan | Monthly | Annual | AI credits/mo | Key notes |
|---|---|---|---|---|
| Free | $0 | $0 | 60 | 7-day limited access. Only 2 lifetime PNG downloads total (not per month). Basic templates. Watermarked. 1GB storage. Team: up to 4 members free. |
| Pro | $29/mo | $14/mo ($168/yr) | 500 | Unlimited downloads (PNG, PDF). All templates. Brand assets. No watermarks. 100GB storage. AI generators (text-to-infographic, text-to-presentation, text-to-report). All AI image tools. Video editing. |
| Business | $49/mo | $24/mo ($288/yr) | 1,000 | Everything Pro plus: PowerPoint (PPT) export, 200GB storage, premium templates, SSO, advanced brand controls. Per member. |
| Education | N/A | $39.99/yr ($3.33/mo) | Pro features | Pro features at 76% discount. Valid academic email required. Best value plan on the platform for eligible users. |
| Enterprise | Custom | Custom | Custom | Dedicated Account Manager, advanced security, onboarding, and custom limits. Contact Piktochart sales. |
PPT export is Business-only: as confirmed by aiproductivity.ai’s review (re-verified June 2026), PowerPoint export is only available on the Business plan ($24/mo annual). Pro supports PNG and PDF downloads only. If PowerPoint delivery to clients or stakeholders is a requirement, Business is the minimum viable plan.
Annual billing saves 52%: as confirmed by the official Piktochart Pro page, annual billing on Pro drops from $29/mo to $14/mo. the steepest annual discount in the infographic tool category. Only commit to annual after verifying the tool fits your workflow.
No refunds: as confirmed by the official Piktochart pricing FAQ, Piktochart generally does not provide refunds for payments made as per their Terms of Use. Test thoroughly on the free plan before subscribing. The 7-day free access is limited but sufficient to evaluate templates and the editor.
How Piktochart Scores
| Category | Score | Notes |
|---|---|---|
| AI infographic generation | Best in class | Text-to-infographic, text-to-presentation and text-to-report generators are the strongest AI visual generation tools for non-designers at this price point. Canva and Visme have AI tools, but not this depth for infographic-specific generation. |
| Data visualization | Excellent | Google Sheets live sync, 30+ chart types, editable maps, Excel import, timelines. Better than Canva for data-driven infographics. Comparable to Visme on chart depth. |
| Ease of use for non-designers | Excellent | As confirmed by aiproductivity.ai’s review, non-designers can create professional infographics in 15 to 30 minutes. Significantly easier than Adobe Illustrator or Photoshop. Lower learning curve than Figma. |
| Template library | Moderate | 5,000+ is well-organized for infographic and report use cases, but significantly smaller than Canva (3.6M+) or VistaCreate (200K+). Narrower category coverage for social media and marketing graphics. |
| Free plan | Very limited | 7-day access and 2 lifetime downloads total. Not a working free tier. A demo at best. Competitors offer permanent free plans with meaningful download allowances. |
| PPT export availability | Business-only | Pro plan only exports PNG and PDF. PowerPoint export requires Business plan at $24/mo annual. Visme includes PPTX export on its Pro plan ($24.75/mo annual). |
| Mobile and platform | Web only | No mobile app. Browser-based only. Not suitable for on-the-go creators who primarily work on mobile devices. |
Who Is Piktochart For?
- A marketer, HR professional or analyst who regularly creates data-driven infographics and visual reports
- An educator who needs to present data and information visually for students. Education plan at $39.99/yr is exceptional value
- A consultant or non-profit who produces branded reports and presentations from data
- Someone who works with Google Sheets and needs charts that auto-update when data changes
- A team of up to 4 who needs shared visual creation at no extra workspace cost
- Anyone who wants AI to generate a complete infographic from a topic in seconds
- A social media manager who needs high-volume social graphics, animated posts and scheduling. Canva or VistaCreate are better
- A user expecting a generous permanent free plan. Piktochart’s free tier is 7 days and 2 lifetime downloads only
- Someone who needs PowerPoint export on a budget. PPT export requires Business plan ($24/mo annual)
- A mobile-first creator. no iOS or Android app available
- A photo editor or graphic designer who needs advanced retouching, layers or creative effects
- A creator who needs a large template variety for branding and marketing assets beyond infographics
Piktochart vs the Alternatives
| Piktochart | Canva | Visme | Venngage | |
|---|---|---|---|---|
| Entry paid (annual) | $14/mo | ~$13/mo | $12.25/mo | ~$10/mo |
| AI infographic generator | Best in class | Good (Magic) | Good (AI Designer) | Good (AI generator) |
| Google Sheets live sync | Yes (Pro) | No | Yes (Pro) | Limited |
| Template library | 5,000+ (focused) | 3.6M+ | 10,000+ | Hundreds |
| Free plan | 2 lifetime downloads | Generous (permanent) | Good (permanent) | Limited (permanent) |
| Best for | Data infographics, AI generation | General design, social | Data visuals, interactive | Corporate infographics |
For full comparisons see our Canva review, Visme review and Venngage review.
Frequently Asked Questions
Is Piktochart free? Piktochart has a free plan but it is not a working free tier. As confirmed by CreatorStackClub’s March 2026 review, the free plan provides 7-day limited access and only 2 lifetime PNG downloads. not 2 per month, but 2 total ever. This makes the free plan a demo rather than a usable ongoing option. For regular use, the minimum is Pro at $14/mo annual. Students and educators can access Pro features for $39.99/year.
How much does Piktochart cost? Pro is $29/month monthly or $14/month billed annually ($168/year per member). Business is $49/month monthly or $24/month billed annually ($288/year per member). The Education plan is $39.99/year ($3.33/month). Enterprise is custom. Verify current pricing at piktochart.com/pricing.
What is the Piktochart AI infographic generator? As confirmed by CreatorStackClub’s March 2026 review and aiproductivity.ai’s review, Piktochart’s AI text-to-infographic generator creates a complete infographic from a text prompt or topic description. You type what the infographic should be about, and Piktochart’s AI produces a full layout with organized sections, relevant icons, chart placeholders and formatted text. Manual editing is still needed for brand customization and final polish, but the AI starting point saves significant time versus starting from a blank canvas.
Does Piktochart export to PowerPoint? As confirmed by aiproductivity.ai’s review (re-verified June 2026), PowerPoint export is only available on the Business plan ($24/mo annual, $49/mo monthly). The Pro plan exports PNG and PDF only. If you need to deliver editable PowerPoint files to clients or stakeholders, the Business plan is the minimum viable option.
Does Piktochart integrate with Google Sheets? Yes. As confirmed by CreatorStackClub’s March 2026 review, Piktochart’s Google Sheets integration allows charts to automatically update whenever the connected spreadsheet data changes. This is one of Piktochart’s strongest practical advantages over general design tools like Canva, which does not offer live Google Sheets data sync.
What are AI credits in Piktochart? AI credits power Piktochart’s Pikto AI Studio image tools: Image Generator, Modifier, Upscaler, Background Remover, Restorer and Icon Generator. Free plan: 60 credits/mo. Pro: 500 credits/mo. Business: 1,000 credits/mo. Credits reset monthly and do not roll over. The AI text-to-infographic, text-to-presentation and text-to-report generators may consume credits separately.
Is Piktochart worth it? As confirmed by CreatorStackClub’s March 2026 review, Piktochart at $14/mo annual is strong value if infographics, data reports and data-driven presentations are a regular part of your workflow. The AI text-to-visual generators are genuinely time-saving for non-designers. If those content types represent less than 50% of your visual work, Canva Pro at a similar price covers more ground with a larger template library, better social media tools and a more generous free plan.
Piktochart Alternatives Worth Considering
Reviewed by our team. Read the full review or head straight to the platform.
Canva
3.6M+ templates, generous free plan, social media tools, animation and video. Better for general design and social media content creation. From ~$13/mo Pro annual.
Visme
Data visualization, interactive HTML5 content and presentations with live Google Sheets integration. Better for interactive and animated data-driven content. From $12.25/mo annual.
Venngage
Infographic and data visualization specialist with WCAG 2.1 accessibility checker. Strong for corporate infographics, healthcare and education content. From ~$10/mo annual.
VistaCreate
Animated social media templates, 200,000+ designs and team collaboration for up to 10 members at $10/mo flat annual. Better for social-first animated content creation.
Pro from $14/mo annual ($168/yr). Education plan $39.99/year. AI infographic generator. Google Sheets live data sync. 5,000+ templates.
Visit Piktochart →
Related: Canva Review | Visme Review | Venngage Review | VistaCreate Review | Snappa Review
Sources used in this article: Piktochart Official Pricing Page (piktochart.com/pricing) Piktochart Pro Page (piktochart.com/pro) CreatorStackClub: Piktochart Review, March 2026 (creatorstackclub.com) aiproductivity.ai: Piktochart Review 2026, June 2026 re-verified (aiproductivity.ai) aiproductivity.ai: Piktochart Pricing 2026 (aiproductivity.ai) topsocialtools.com: Piktochart Features and Pricing 2026 (topsocialtools.com) itqlick.com: Piktochart Pricing 2026. Hidden Costs and ROI (itqlick.com)